Candlestick charts are one of the most popular tools in technical analysis for understanding stock price movements. They originated in Japan over 300 years ago and were initially used to trade rice, but today they’re widely used by traders worldwide to analyze financial markets. What makes candlesticks so useful is that they provide a visual representation of price action over a given period and convey a lot of information in a simple, easy-to-read format.
Candlestick charts help traders identify patterns and trends, allowing them to make more informed decisions about when to buy or sell a stock. By learning how to read candlesticks and recognizing key patterns, traders can better anticipate potential price movements.
How to Understand Candlesticks
Each candlestick provides four key pieces of information about a stock’s price during a specific period of time:
- Open: The price at which the stock opened at the beginning of the time period.
- Close: The price at which the stock closed at the end of the time period.
- High: The highest price the stock reached during the time period.
- Low: The lowest price the stock reached during the time period.
A candlestick consists of two main parts:
- The Body: This is the thick part of the candlestick and shows the difference between the opening and closing prices. If the closing price is higher than the opening price, the body is usually green or white, indicating bullish movement. If the closing price is lower than the opening price, the body is usually red or black, indicating bearish movement.
- The Wicks (or Shadows): These are the thin lines extending from the top and bottom of the body. The upper wick shows the highest price reached during the period, while the lower wick shows the lowest price.
The length of the body and wicks provides insights into market sentiment. For example, a long body suggests strong buying or selling pressure, while long wicks indicate potential indecision or price rejection at certain levels.
Basic Candlestick Patterns
1. Single Candlestick Patterns:
A) Doji: The open and close prices are almost equal, indicating indecision in the market. It suggests a potential reversal in the current trend.
Interpretation: A Doji represents indecision in the market between buyers and sellers. Neither side is able to gain full control, as the price ends up closing very close to where it opened. The appearance of a Doji after an uptrend or downtrend could signal that the current trend is weakening and a reversal may be imminent. However, confirmation from the following candles (e.g., a bullish or bearish candlestick) is usually necessary before acting on the signal.
B) Hammer
The Hammer has a small body at the top of the range and a long lower wick (shadow), which is at least twice the size of the body. There is little to no upper wick.
Interpretation: A hammer appears after a downtrend, indicating that sellers pushed the price lower during the session, but buyers stepped in to drive the price back near the opening level. This suggests that buyers are gaining strength, and a reversal may occur.
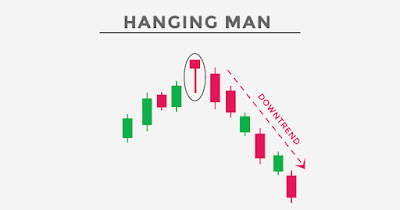
C) Hanging Man
The Hanging Man is a bearish reversal pattern that forms after an uptrend. It has a small body near the top of the trading range and a long lower shadow (wick), with little to no upper shadow. The long lower shadow indicates that sellers pushed the price lower during the session, but buyers brought it back near the open.
Interpretation:
The Hanging Man suggests that selling pressure is increasing, even though the price closed near the open. If the price opens lower or is followed by a bearish candle in the next session, it confirms the potential reversal of the uptrend. However, confirmation from subsequent candles is necessary for a stronger signal.
2) Two-Candlestick Patterns:
A) Bullish Engulfing: A smaller bearish
candlestick followed by a larger bullish candlestick. This suggests that buyers
have taken control and the price may rise.
B) Bearish Engulfing: A smaller bullish
candlestick followed by a larger bearish candlestick. It signals potential
downside as sellers gain control.
3) Three-Candlestick Patterns:
A) Morning Star: The Morning Star
is a three-candlestick bullish reversal pattern that typically forms at the
bottom of a downtrend. It begins with a large bearish candle, indicating strong
selling pressure. The second candlestick is small, often a Doji or spinning
top, representing indecision or a pause in the downtrend. The third candlestick
is a large bullish candle that closes well into the body of the first candle,
confirming the reversal.
Interpretation: The Morning Star signals
that buyers are stepping in after a period of selling, and the downtrend is
likely to reverse into an uptrend, especially when confirmed by other
indicators.
B) Evening Star: The Evening Star is a bearish reversal pattern that appears at the top of an uptrend, indicating a potential reversal of the current bullish trend into a downtrend. It consists of three candlesticks. The first candlestick is a large bullish (green or white) candlestick that continues the uptrend. Second Candlestick: A small-bodied candlestick (could be bullish or bearish) that opens higher than the previous close, often resembling a Doji or a spinning top. This shows indecision or weakening buying pressure. Third Candlestick: A large bearish (red or black) candlestick that closes well into the body of the first bullish candle, confirming the reversal of the trend.
Interpretation: The Evening Star signals that the bullish momentum has peaked, and sellers are beginning to take control. The pattern reflects the transition from strong buying pressure to hesitation (the second candle), followed by increasing selling pressure (the third candle).


No comments:
Post a Comment
Note: Only a member of this blog may post a comment.