In technical analysis, several common chart patterns can help traders and investors identify potential price movements in the stock market. Here are some of the most recognized patterns:
1. W Pattern (Double Bottom)
Description: This pattern resembles the letter "W" and indicates a potential bullish reversal.
Interpretation: The stock price makes two lows at roughly the same level, with a peak in between. Once the price breaks above the peak, it suggests a bullish reversal.
2. M Pattern (Double Top)
Description: This pattern looks like the letter "M" and signals a potential reversal in an uptrend.
Interpretation: The stock price reaches two highs at approximately the same level, with a trough in between. A break below the trough indicates a bearish reversal.
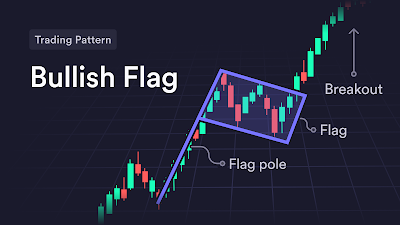
3. Flags
Description: Flags are short-term continuation patterns that can be bullish or bearish.
Interpretation: After a strong price movement (pole), the price consolidates in a parallel channel (the flag). A breakout in the direction of the previous trend suggests that the trend will continue.
4. Head and Shoulders
Description: This reversal pattern can indicate a change in trend direction.
Regular Head and Shoulders: Signals a reversal from bullish to bearish.
Inverse Head and Shoulders: Signals a reversal from bearish to bullish.
Interpretation: The pattern consists of three peaks: a higher peak (head) between two lower peaks (shoulders). A breakout below the neckline confirms a bearish reversal.
5. Cup and Handle
Description: This bullish continuation pattern resembles a cup with a handle.
Interpretation: The price forms a rounded bottom (the cup) followed by a consolidation period (the handle) before breaking out to the upside.
6. Triangles
Description: Triangles are continuation patterns that can be ascending, descending, or symmetrical.
Interpretation:
Ascending Triangle: Bullish pattern where resistance is horizontal, and support is rising.
Descending Triangle: Bearish pattern where support is horizontal, and resistance is falling.
Symmetrical Triangle: Indicates consolidation and can break in either direction.
7. Rectangles
Description: Also known as trading ranges, these patterns indicate periods of consolidation.
Interpretation: The price bounces between horizontal support and resistance levels. A breakout above resistance signals a bullish move, while a breakdown below support indicates a bearish move.


No comments:
Post a Comment
Note: Only a member of this blog may post a comment.